workshops
Training Course for Ansible Automation Platform
This project is maintained by ericzji
Exercise 2.2 - Threat hunting
Step 2.1 - The Background
Threat detection and response capabilities require from a security operator typically to deploy many tools to secure an enterprise IT. Due to missing processes and a lot of manual work this is a serious challenge to proper IT security operations!
In this exercise, we imagine that we are a security operator in charge of an enterprise firewall in a larger organization. The firewall product used here is Check Point Next Generation Firewall.
Step 2.2 - Preparations
For this exercise to work properly, the playbook whitelist_attacker.yml must have been run at least once. Also the logging for the attacker whitelist policy must have been activated. Both was done in the Check Point exercise in section 1. If you missed the steps, go back there, execute the playbook, follow the steps to activate the logging and come back here.
Also, in the Check Point SmartConsole interface, go to SECURITY POLICIES. You will see two entries there. On the upper one, in the column action, click on Accept. This open a menu: click on Drop there, changing the policy to drop such packets. In the menu above, click on Install Policy, that opens a window, click the Publish & Install button there. Another window opens, click on the Install button there. This way we have effectively changed the whitelist to a blacklist entry.
Note
We could have done this change via a playbook. But we want to keep the amount of playbooks in the prep phase to as few as possible.
Next we again need suspicious traffic - an attack. Again we have a playbook which simulates a simple access every five seconds on which the other components in this exercise will later on react to. On your control host, create the playbook ddos_attack_simulation.yml with the following content:
---
- name: start attack
  hosts: attacker
  become: yes
  gather_facts: no

  tasks:
    - name: simulate attack every 5 seconds
      shell: "/sbin/daemonize /usr/bin/watch -n 5 curl -s http://{{ hostvars['snort']['private_ip2'] }}/ddos_simulation"
Execute the playbook:
[student<X>@ansible ansible-files]$ ansible-playbook ddos_attack_simulation.yml
Addtionally we will use the role to modify IDS rules from the previous Snort exercise. If you missed that, install them via: ansible-galaxy install ansible_security.ids_rule
The stage is set now. Read on to learn what this use case is about.
Step 2.3 - See the attack
You are a security operator in charge of an enterprise firewall in a larger cooperaiton. You just found that a policy enforced by a Check Point Next Generation Firewall (NGFW), protecting your line of business applications, has been repeatedly violated. To showcase this, open the SmartConsole on your Windows workstation, access the Check Point management server and on the left side click on the LOGS & MONITOR tab:
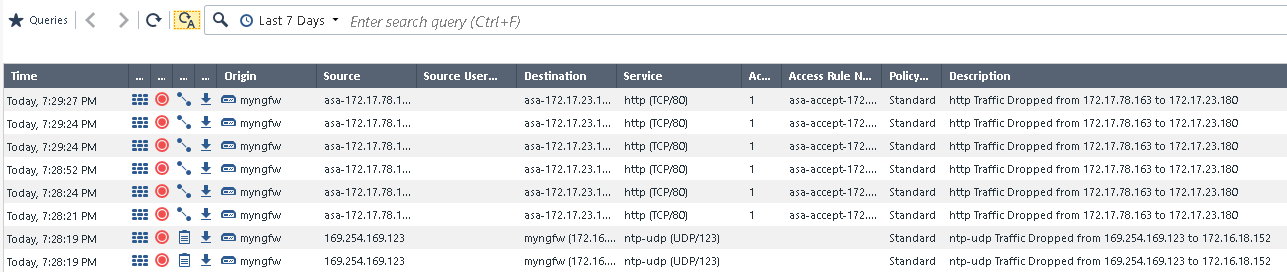
As you can see, a series of messages with the description http Traffic Dropped there, repeating again and again over time.
Note
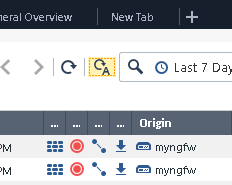
If you do not see any logs, auto refresh might not be activated. If that is the case, click on the corresponding button, an A next to a circle:
Seeing these violations we should start an investigation to assess if they are the outcome of an attack. The best way to investigate is to correlate the firewall logs with logs generated by other security solutions deployed in our network - like Snort - in a log management tool like QRadar.
Step 2.4 - Create and run a playbook to forward logs to QRadar
However, as mentioned in many enterprise environments security solutions are not integrated with each other and, in large organizations, different teams are in charge of different aspects of IT security, with no processes in common. In our scenario, the typical way for a security operator to escalate the issue and start our investigation would be to contact the security analysis team, manually sending them the firewall logs we used to identify the rule violation - and then wait for the reply. A slow, manual process.
But, as shown with the last exercise, we can automate this process with Ansible! The can be pre-approved automation workflows in form of playbooks, provided to us by the security analysis team. With such an Ansible playbook, every time we are in a threat hunting situation, we can automatically configure the enterprise firewall to send its events/logs to the QRadar instance that security analysts use to correlate the data and decide how to proceed with the potential threat.
Let’s write a playbook to enable log forwarding from Check Point to QRadar and create a log source in QRadar. We can partially re-use the main playbook from the last exercise where we already connected Check Point with QRadar.
On your control host, create the file threat_cp_log.yml with the following content:
---
- name: Configure Check Point to send logs to QRadar
  hosts: checkpoint

  tasks:
    - include_role:
        name: ansible_security.log_manager
        tasks_from: forward_logs_to_syslog
      vars:
        syslog_server: "{{ hostvars['qradar']['private_ip'] }}"
        checkpoint_server_name: "YOURSERVERNAME"
        firewall_provider: checkpoint

- name: Add Check Point log source to QRadar
  hosts: qradar
  collections:
    - ibm.qradar

  tasks:
    - name: Add Check Point remote logging to QRadar
      qradar_log_source_management:
        name: "Check Point source - {{ hostvars['checkpoint']['private_ip'] }}"
        type_name: "Check Point FireWall-1"
        state: present
        description: "Check Point log source"
        identifier: "{{ hostvars['checkpoint']['private_ip'] }}"

    - name: deploy the new log sources
      qradar_deploy:
        type: INCREMENTAL
      failed_when: false
Note
Remeber to replace the value
YOURSERVERNAMEwith your actual server name as mentioned in the last exercise.
Execute the playbook:
[student<X>@ansible ~]$ ansible-playbook threat_cp_log.yml
In Check Point SmartConsole you might even see a little window pop up in the bottom left corner informing you about the progress. If that gets stuck at 10% you can usually safely ignore it, the log exporter works anyway.
Step 2.5 - Verify new configuration
Let’s quickly verify the new configuration, like we did in the last exercise. We start with Check Point: In Check Point the easiest way to verify that the log source is set is indeed via command line. From your control host ansible, use SSH as the user admin to log into the Check Point management server and issue the following ls comand. If you do not remember your Check Point server IP address, check it out with grep checkpoint ~/lab_inventory/hosts
[student<X>@ansible ~]$ ssh admin@11.33.44.55
[Expert@gw-77f3f6:0]# ls -l /opt/CPrt-R80/log_exporter/targets
total 0
drwxr-xr-x 6 admin root 168 Sep 16 11:23 syslog-22.33.44.55
Leave the Check Point management server again with exit
Imagine we are now the security analysts in charge of QRadar. As such, without any further doing, we suddenly get additional logs in QRadar. Verfify this by logging into the QRadar web UI. Click on Log Activity and verify that events are making it to QRadar from Check Point:
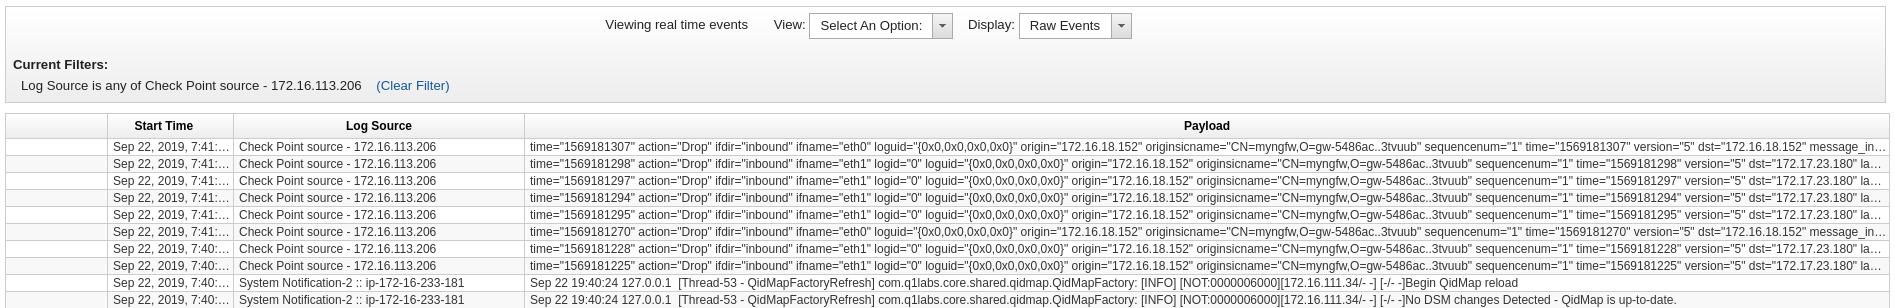
If the logs get drowned in QRadar’s own logs, create a filter. Or click on unwanted log lines in the column Log Source, and pick Filter on Log Source is not … to create filters on the fly to filter out unwanted traffic.
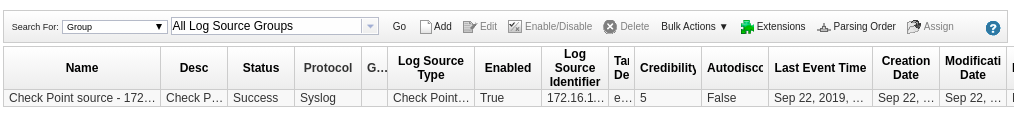
Let’s verify that QRadar also properly shows the log source. In the QRadar UI, click on the hamburger button in the left upper corner, and click on Admin. In there, click on Log Souces. A new window opens and shows the new log source.
Step 2.6 - Offenses
Next we want to manage Offenses shown in QRadar. Currently non are generated - but are some already pre-configured for this use case? In the QRadar web UI, open the Offenses tab. On the left side menu, click on Rules. Above, next to Group, click on the drop down menu and select Ansible. All preconfigured offense rules for this workshop are shown:
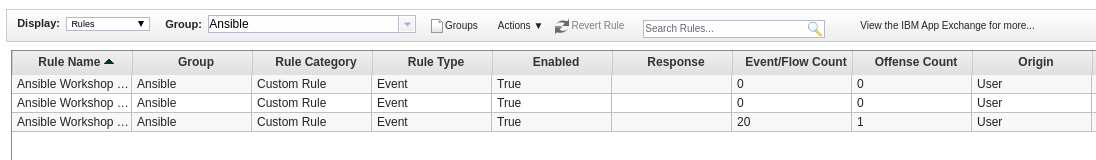
Double-click on the rule called Ansible Workshop DDOS Rule. The rule wizard window opens, allowing us changes to the offense rule if needed:
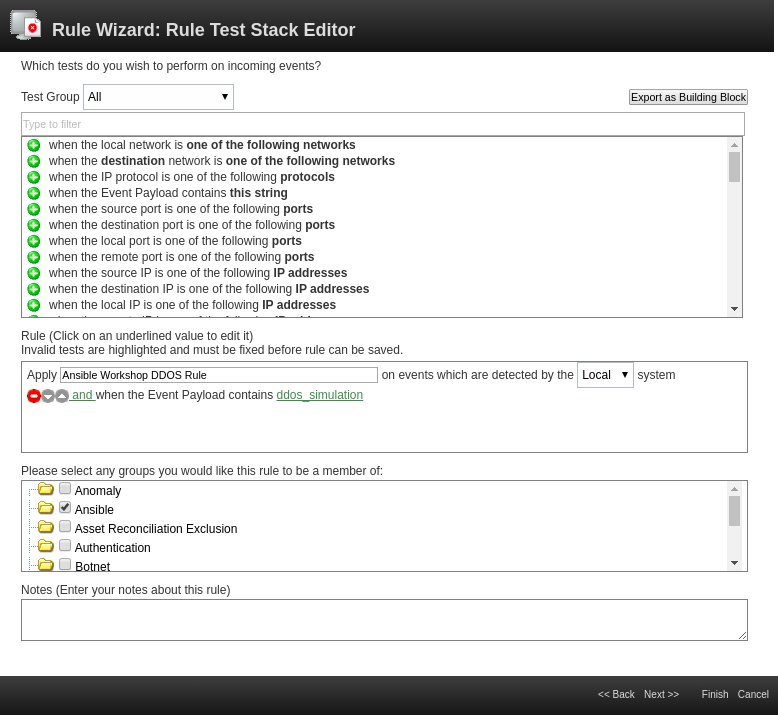
From the wizard you can see that we only use very checks (second box in the window). Rules can be much more complex, can even depend on other rules and as a result do not have to create offenses, but for example can create additional log entries. We will not do any changes here, so leave the wizard with a click on Cancel in the bottom right corner and confirm the close-warning of your browser.
To decide if this violation is a false positive, we need to make sure that other sources are not performing an attack which we might not see in the firewall. To do that we need to access the logs generated by the IDS and decide to check for a specific attack pattern that could be compatible with the violation on the firewall.
Step 2.7 - Add Snort rule
In a typical situation, accessing IDS logs would again require another interaction with the security operators in charge of the IDS. Asking for a new rule, specific for a single investigation, could be even more complicated. But we as a security analyst usually in charge of QRadar can launch Ansible playbooks to achieve the same goal in seconds.
First, we run a playbook to configure Snort with a new signature. The signature here is specific to our attack - in real life you might identify the signature by your extended analysis, or in best case together with the team responsible for the application in question.
On your control host, create the file threat_snort_rule.yml to add a new rule to Snort:
---
- name: Add ids signature for ddos
  hosts: ids
  become: yes

  vars:
    ids_provider: snort
    protocol: tcp
    source_port: any
    source_ip: any
    dest_port: any
    dest_ip: any

  tasks:
    - name: Add snort ddos attack rule
      include_role:
        name: "ansible_security.ids_rule"
      vars:
        ids_rule: 'alert {{protocol}} {{source_ip}} {{source_port}} -> {{dest_ip}} {{dest_port}}  (msg:"Attempted DDoS Attack"; uricontent:"/ddos_simulation"; classtype:successful-dos; sid:99000010; priority:1; rev:1;)'
        ids_rules_file: '/etc/snort/rules/local.rules'
        ids_rule_state: present
As you can see we add a new snort rule matching on the parameters of the attack. In our example we again check for URI content.
Run the playbook:
[student<X>@ansible ~]$ ansible-playbook threat_snort_rule.yml
Quickly verify the new rule on the Snort instance. From your control host log in to Snort via SSH with the user ec2user:
[student<X>@ansible ~]$ ssh ec2-user@11.22.33.44
Last login: Fri Sep 20 15:09:40 2019 from 54.85.79.232
[ec2-user@snort ~]$ sudo grep ddos_simulation /etc/snort/rules/local.rules
alert tcp any any -> any any  (msg:"Attempted DDoS Attack"; uricontent:"/ddos_simulation"; classtype:successful-dos; sid:99000010; priority:1; rev:1;)
Leave the Snort server via the command exit
Also we have to make sure that logs from Snort make it to QRadar, so let’s reuse parts of the playbook from the last exercise. Create a file called threat_snort_log.yml:
---
- name: Configure snort for external logging
  hosts: snort
  become: true
  vars:
    ids_provider: "snort"
    ids_config_provider: "snort"
    ids_config_remote_log: true
    ids_config_remote_log_destination: "{{ hostvars['qradar']['private_ip'] }}"
    ids_config_remote_log_procotol: udp
    ids_install_normalize_logs: false

  tasks:
    - name: import ids_config role
      include_role:
        name: "ansible_security.ids_config"

- name: Add Snort log source to QRadar
  hosts: qradar
  collections:
    - ibm.qradar

  tasks:
    - name: Add snort remote logging to QRadar
      qradar_log_source_management:
        name: "Snort rsyslog source - {{ hostvars['snort']['private_ip'] }}"
        type_name: "Snort Open Source IDS"
        state: present
        description: "Snort rsyslog source"
        identifier: "{{ hostvars['snort']['private_ip']|regex_replace('\\.','-')|regex_replace('^(.*)$', 'ip-\\1') }}"
Run the playbook:
[student<X>@ansible ~]$ ansible-playbook threat_snort_log.yml
In QRadar, access the log activity tab. Validate, that in QRadar no events from the IDS are generated. That way you know for sure that the anomaly you see is only caused by the single IP you have in the firewall. No other traffic is causing the anomaly, you can safely assume that the anomaly you see is a false positive.
Note
In reality you might perform additional steps analyzing the machines behavior to exclude the possibility that it has been compromised.
Step 2.8 - Whitelist IP
We have determined that the host is not performing an attack and finally confirmed that the firewall policy violation is a false positive, probably caused by a misconfiguration of the whitelist group for that application. So we can whitelist the IP in the firewall to let events come through.
Instead of starting even another manual interaction with the firewall team to have the source IP whitelisted, we can simply launch the whitelisting Ansible playbook to achieve the same goal in seconds.
For this we can re-use the playbook we wrote earlier in the first Check Point exercise, whitelist_attacker.yml. Run the playbook, to effectively white list the IP:
[student<X>@ansible ~]$ ansible-playbook whitelist_attacker.yml
Verify that the IP is now whitelisted and does not generate deny messages in Check Point anymore. Open the SmartConsole on your Windows workstation, access the Check Point management server and go to the logs tab.
Note
In rare cases during our tests the policy was changed, but not applied. If that is the case for you as well and you see no new logs even with Auto Refresh turned on, then go to the tab SECURITY POLICIES and click on Install Policy.
Step 2.9 - Rollback
As the final step, we can run one last Ansible Playbook to rollback all the Check Point and Snort configurations back to their pre-investigation state, reducing resource consumption and the analysis workload.
Execute the playbook rollback.yml we wrote in the last exercise to roll all changes back.
[student<X>@ansible ~]$ ansible-playbook rollback.yml
Also we need to kill the process sending out attack. On your control host, execute the follwing Ansible ad-hoc command:
[student1@ansible ~]$ ansible attacker -b -m shell -a "sleep 2;ps -ef | grep -v grep | grep -w /usr/bin/watch | awk '{print $2}'|xargs kill &>/dev/null; sleep 2"
attacker | CHANGED | rc=0 >>
If you get an error saying Share connection to ... closed., don’t worry: just execute the command again.
You are done with the exercise. Turn back to the list of exercises to continue with the next one.
Click Here to return to the Ansible Security Automation Workshop